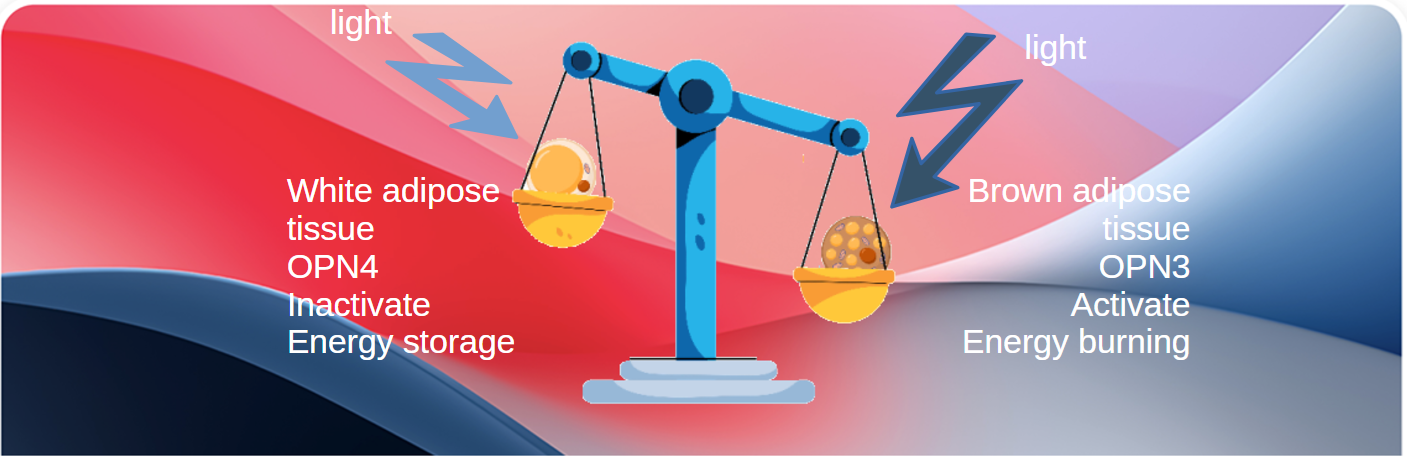
This post critically examines the notion that different colors of light can influence adipose or adipose stem cells. While photobiomodulation might have a place in clinics that use adipose stem cells for regenerative therapies, there just seem to be a lot of unanswered questions. The science is certainly interesting!
Background, opsins, visible light, fat burning, Sato 2020
The featured image was adapted from this publication. The rest is a direct quote from the abstract.
Purpose of Review
Obesity alters the metabolic and endocrine functions of adipose tissues and increases the risk of developing type 2 diabetes mellitus. Reducing the volume of white adipose tissue (WAT) and activating the function of brown adipose tissue (BAT) are potential therapeutic approaches to treating and preventing obesity. This review aims to investigate the efficacy of photoreceptor-dependent light therapy targeting adipose tissues.
Recent Findings
To reduce the volume of WAT, phototherapy is performed for cosmetic purposes via low-level laser-assisted lipoplasty. However, the underlying mechanisms of such therapy have not been evaluated. Recently, photoreceptor opsins have been found to be expressed in both WAT and BAT. Opsins expressed in adipose tissues are capable of sensing light, and molecular signaling induced by this photoreception modulates the metabolic functions of adipose tissues. Light stimulation via opsins initiates G protein-coupled receptor (GPCR) signaling, increases the rate of lipolysis in WAT, and activates thermogenesis in BAT. These functional changes in adipose tissues upregulate whole-body energy expenditure.
Summary
Photoreceptor opsins expressed in WAT and BAT respond to light to initiate GPCR-related signaling and increase metabolic activity. Opsins in adipose tissues are thus potential targets for phototherapy in the treatment and prevention of obesity and associated disorders. These findings offer a potential molecular foundation for the further development of light-based therapy.
Note: Opsins 3 and 4 absorb in the blue to green region of the electromagnetic spectrum as illustrated in this cartoon. The absorption maximum is slightly bluer for OPN3. The similarities of the two absorption spectra means absolutely nothing because what’s downstream could be entirely different in terms of signaling.
Two tables from the everything review deFreitas & Hamblin
This review has an incredible background on photobiomodulation that this post will not attempt to summarize. There are two tables of physical definitions that are hard to find elsewhere. The notion that light does what it does to adipose tissue via opsins needs to be integrated into the notion that the opsin family of G protein coupled receptors can be turned off by arrestins when they are turned on for too long.
Irradiation Parameters
| Irradiation Parameter | Measurement unit | Description |
| Wavelength | nm | Light is an electromagnetic form of energy with a wave-like behavior. Its wavelength is measured in nanometers (nm), and it is visible within the 400–700 nm range. |
| Irradiance | W cm−2 | It can also be called Power Density or Intensity, and corresponds to the power (in W) divided by the area (in cm−2). |
| Pulse Structure | Peak Power (W) Pulse frequency (Hz) Pulse width (s)Duty cycle (%) | If the beam is pulsed, the Power should be called Average Power, which is calculated as follows: Average Power (W) = Peak Power (W) x pulse width (s) x pulse frequency (Hz) |
| Coherence | Coherence length depends on spectral bandwidth | Coherent light produces laser speckle, which is believed to play an important role on photobiomodulation interaction with cells andorganelles. |
| Polarization | Linear polarized or circular polarized | Polarized light is known to lose its polarity in highly scattering media such as biological tissues, therefore this property is not considered very often on the effects of PBM. |
Irradiance is the power density as opposed to the energy density. Energy, measured in Joules, is the ability to cause change while power is the rate at which the energy is moved are used. A Joule in Science International units is kgm2sec-2 lor just Newton meters, Nm.
Light Dose parameters
| Irradiation Parameter | Measurement unit | Description |
| Energy | Joules (J) | It cannot be mistook as dose, as it assumes reciprocity (the inverse relationship between power and time). It is calculated as: Energy (J) = Power (W) x Time (s) |
| Energy Density | J cm−2 | This is an important descriptor of dose, but it could be unreliable when we consider that it assumes a reciprocity relationship between irradiance and time. |
| Irradiation Time | s | Possibly the best way to prescribe and to record PBM would be to define the four parameters of the previous table and then define the irradiation time as the real “dose”. |
| Treatment Interval | Hours, days or weeks | Different time intervals may result in different outcomes, but more data need to be gathered in order to define the extent of the differences between them. |
visible light colors and osteogenic differentiation Wang 2016
The following are some gene transcript players in this process
- RUNX-2 is a transcription factor.
- Osteocalcin (OCN) is a non-collagenous protei specific in bone as well as a marker of osteoblast differentiation.
- Osterix (OSX) is an important transcription factor in the end stage of osteoblast differentiation.
| 400-430, 415 nm, blue light LED array, mW/cm2 | 525–555 nm, 540 nm green light, a filtered lamp |
| 660 nm red light, diode laser | 810 nm red light, diode laser. |
- Fig 1 540nm green light followed by 420 nm blue light are the best for inducing transcription of these genes.
- Fig 2 Alizrin red stain for mineralization revealed the same trend of 540 nm green is better than 420nm blue, and the red/NIR. The new information is that TRP Ca2+ channel inhibitors blunt this boost.
- Fig 3 This effect was due to blockage of intracellular Ca2+.
- Fig 4 TRP channel inhibitors blunted the light induced changes in gene transcripts seen in Fig 1.
Osteo blasts from human adipose stem cells
So far our narrative has been pretty useless for use in whole humans simply because blue and green light cannot penetrate deep into our bodies. What about the ever present adipose stem cell therapy? These cells are cultured before they are differentiated and released back into our bodies to do their thing.
- Fig 1 Wang 2017 used a compound called Sulforhodamine B to estimate protein concentrations in monolayers of cultured cells. Over the course of 48 hours protein content increased without light. Protein decreased with 420 nm and 540 nm light.
- Fig 2 Red and NIR increased ATP content of the cultured cells while green and blue light decreased ATP. The panels of this figure went on to establish an ATP response as a function of input light energy. For red and NIR light, the response was bell shaped. For green and blue light ATP decreased with increasing light energy.
- Fig 3 explored potential mechanisms A. Intracellular calcium was increased by 540 nm green light. B, Mitochondrial membrane was decreased by 415 nm red and 540 nm green light. Both reds increased MMP. C Intracellular reactive oxygen species ROS) were increased by all wavelengths of light with 415 nm blue being worse than 540 nm green, and more than red and NIR. D Intracellular pH is dropped from 7.4 to 603-ish by 415 nm and 540 nm light. Red and NIR do not even significantly increase intracellular pH.
- Fig 4 The sulforhodamine B assay was again used to measured protein concentration which was explored in the context of capsaicin opening of TRPV1 Ca2+ channels that are also opened by heat and perhaps light. Capsaicin is the compound in chili peppers that renders the sensation of heat via increases in intracellular Ca2+. A small dose of capsaicin increases protein while larger does decrease it. We know this is a direct effect on TRPV1 channels because a TRPV1 inhibitor blunts the increase in protein. These results are somewhat not congruent with those of Yu 2025 who demonstrated that blue light in melanocytes activatesTRPV1 via OPN3 to inhibit autophagy, self eating.
- Fig 5 Inhibition of TRPV1 blunts the 415nm and 540 nm A a decrease in protein B an increase in intracellular Ca2+, and C an increase in ROS. Panels D and E looked at relative levels of protein and ROS with TRPV1 inhibition in the absence of light.
Wang 2017 claimed that an opsin, light absorbing G-protein coupled receptors in the retina and elsewhere, were responsible for activating TRPV1. They proved that TRP1 was expressed in human adipose stem cells but did not address the presence of OPN3 and/or OPN4.
References
- de Freitas LF, Hamblin MR. Proposed Mechanisms of Photobiomodulation or Low-Level Light Therapy. IEEE J Sel Top Quantum Electron. 2016 May-Jun;22(3):7000417. PMC free paper
- Sato, M. Significance and Application of Light Therapy Based on Photoreceptors to the Regulation of Fat Metabolism. Curr Oral Health Rep 8, 84–89 (2021).TY – JOUR
- Wang Y, Huang YY, Wang Y, Lyu P, Hamblin MR. Photobiomodulation (blue and green light) encourages osteoblastic-differentiation of human adipose-derived stem cells: role of intracellular calcium and light-gated ion channels. Sci Rep. 2016 Sep 21;6:33719. PMC free paper.
- Wang Y, Huang YY, Wang Y, Lyu P, Hamblin MR. Red (660 nm) or near-infrared (810 nm) photobiomodulation stimulates, while blue (415 nm), green (540 nm) light inhibits proliferation in human adipose-derived stem cells. Sci Rep. 2017 Aug 10;7(1):7781. PMC free paper
- Yu E, Oh SW, Park SH, Kwon K, Han SB, Kang SH, Lee JH, Ha H, Yoon D, Jung E, Song M, Cho JY, Lee J. The Pigmentation of Blue Light Is Mediated by Both Melanogenesis Activation and Autophagy Inhibition through OPN3-TRPV1. J Invest Dermatol. 2025 Apr;145(4):908-918.e6. PubMed
Leave a Reply