This post explores a very nice five week study on the use of PEMF in a mouse model of fatty liver disease. The authors present evidence of possible involvement of calcium calmodulin upstream of AMPK and reactive oxygen species sensitive regulator of anti-oxidant enzyme transcription Nrf-2.
Zhai M, Zhang C, Cui J, Liu J, Li Y, Xie K, Luo E, Tang C. Electromagnetic fields ameliorate hepatic lipid accumulation and oxidative stress: potential role of CaMKKβ/AMPK/SREBP-1c and Nrf2 pathways. Biomed Eng Online. 2023 May 22;22(1):51. PMC free paper
The device used in this study delivered PEMF with a peak field strength of an average of 1.6 mT. The intervention lasted for five weeks. The following fatty liver disease player proteins were measured on protein level.
- control group standard chow diet,
- High Fat Diet diet (HFD) rich in fatty acids
- HFD + PEMF 2 h once a day.
Signaling molecules examined
These molecules take the signal from the PEMF to the nucleus to change the status of the mouse’s response to the HFD.
- CaMKKβ is a kinase activated by binding of Ca2+-calmodulin complexes. PEMF somewhat reversed the HFD decrease in expression
- AMPK is a kinase activated when the ratio of AMP (adenosine mono phosphate) exceeds that of ATP (adenosine tri phosphate) and is generally considered a regulator of a low energy balance. It becomes when another kinase like CaMKKβ phosphorylates it.
- SREBP-1c is a transcription factor. Transcription factors call in the machinery to produce messenger RNA of genes. These mRNA are translated into proteins.

The following table is some estimations of bar graph averages in this public access publication. The interested reader is invited to view the data for themselves. PMC free paper.
#PEMF improves HFD consequences to close to the control #
Pay close attention to entries in the “HFD + PEMF” column with a “#” but no ” *” These are different from the HFD alone but statistically the same as the control group. These numbers have been estimated from bar graphs for a general feel for the changes.
| parameter | control | HFD | HFD+PEMF |
|---|---|---|---|
| body weight g | 30 | 40* | 35# |
| liver weight g | 1.8 | 2.4* | 1.9# |
| triglyceride level mmol/L | 0.7 | 0.85* | 0.9# |
| Oil Red staining, fat marker | 0.5 | 1.6* | 1# |
| CaMKKβ/β-actin relative to house keeping protein | 0.45 | 0.2* | 0.35# |
| pAMPK/AMPK, fraction activated | 1.2 | 0.3* | 0.7*# |
| SREBP-1c/β-actin protein level | 0.2 | 0.48* | 0.45*# |
| mean hepatic oxidative stress | 8 | 23* | 15*# |
| MDA mmol/mg tissue, oxidative stress marker | 1 | 1,8* | 1.3*# |
| Nrf-2 / H3 protein level relative to histone protein | 0.4 | 0.18* | 0.25*# |
| SOD activity mU per mg protein 🢃 super oxide | 1.1 | 0.6* | 0.6* |
| catalase activity mU per mg protein 🢃 H2O2 | 0.5 | 0.4* | 0.4* |
| GSH-Px mU mg protein 🢃 lipid oxidation | 320 | 200* | 280# |
PEMF increased the protein levels of Nrf2 suggestive of increased mRNA transcription/translation into protein and/or decreased degradation. The latter is a hallmark of how the scientific community thinks Nrf-2 signals. The authors remarked that while Nrf-2 is thought to increase super oxide dismutase, catalase, and glutathione peroxidase transcripts, PEMF only increased GSH-Px activity.
This cartoon illustrates how oxidative stress prevents proteosome degradation of Nrf-2. It seems kind of wasteful but effective, eh?
A very nice study…
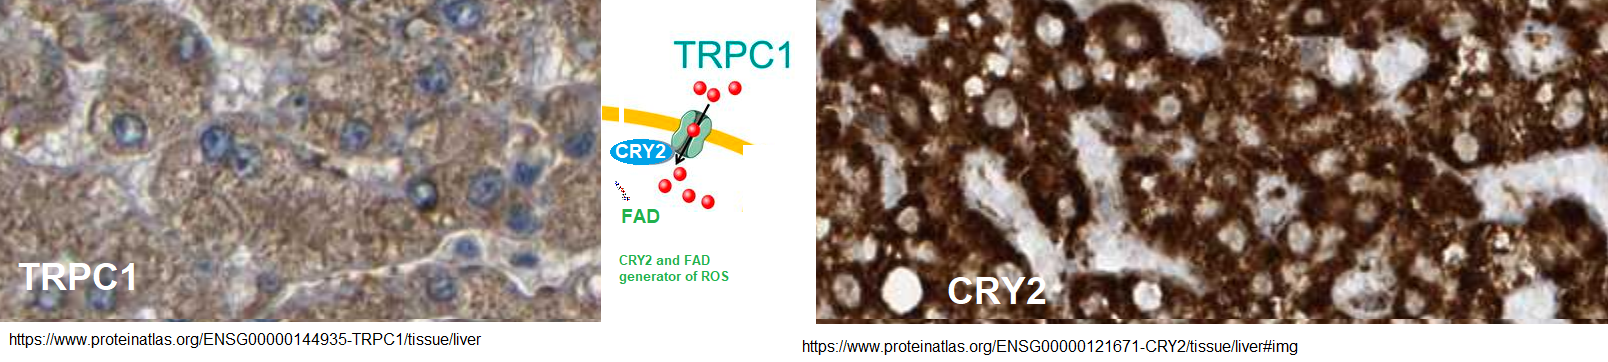
Even nice studies have limitations. The authors acknowledged that they did not prove whether the EMF requires CaMKKβ to act on AMPK. They could not have easily shown an incrae in intracellular Ca2+ in their system. This site has explored PEMF and voltage gated calcium channels that are more in the neurons and muscle than the liver. TRPC1 and cryptochrome 2 is considered a target of PEMF. According to ProteinAtlas, see URL in featured image, TRPC1 is moderately expressed in human hepatocytes. Cryptochrome 2 staining in human hepatocytes is very intense.
Leave a Reply